Configuring A Device
Navigation
This can be accessed via the Device Dashboard page.
Overview
On this page, device parameter information is displayed and can be interacted with. This page is split up into 3 tabs, namely:
- The Overview Tab
- The View Tab
- The Edit Tab
The Overview Tab
The Overview tab contains parameter cards and chips. These can be filtered by status using the drop down menu.
Parameter Cards And Chips
Parameter cards and chips both display information such as:
Parameter readings
The current value of the parameter will be displayed here. The format of the value is dependent on the currently selected template. In the case of chips, icons will be displayed here in specific cases.
Parameter statuses
This is indicated with the status below the reading, as well as by the color of the card/chip.
Parameter alert configurations
This is indicated by the bell icon ,which indicates that an alert group is set, and a monitor icon, which indicates that server alerts are enabled. The number displayed indicates how many rules are currently set on the parameter.
Editing Parameters
Clicking on any card or chip will select it. This can be done for multiple cards or chips.
The selected cards or chips will then turn pink to indicate it has been selected and a menu will open on the right hand side of the screen.
Clicking on the pencil icon will allow you to edit the parameter.
Editing Details
Here you can edit the parameter's name, and template.
Templates define how the reading will be formatted for display on the dashboard. For example, when editing a temperature probe, you can select between degrees Celsius or degrees Fahrenheit.
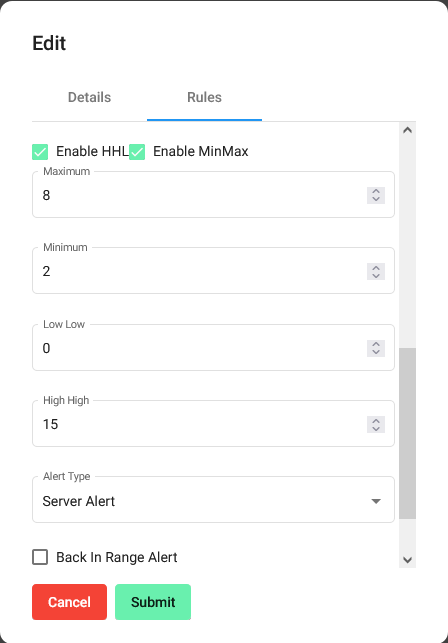
Editing Rules
Alerts can be configured by clicking on the rules tab. Rules can be applied to a parameter to configure the server to dispatch alerts when the specified condition triggers.
The setpoint rule can be applied to a parameter to configure the server to dispatch alerts when the configured threshold is exceeded.
To configure the setpoint rule follow the following steps:
- Click the plus button and select the rule named setpoint.

- Configure the alert by adding a delay. Delays determine the duration at which the value remain above or below the given configuration before an alert is dispatched.

- Select an alert group.

- Adding the alert conditions. Setting a minimum and maximum value will allow you to receive alerts when the sensor value goes above or below the set value. This allows you to define a normal working value range for your sensor, so that you can receive alerts if these are surpassed. Setting a LowLow and HighHigh will allow you to receive alerts immediately if critical values are reached. These alerts are regarded as critical and will ignore any delay set.

- After you are done click save, then click submit.


Graphing Parameters
Parameters can also be graphed by clicking the graph icon on the selection menu.
On this screen you can graph your parameter's data according to various time-ranges.
Time ranges can be selected via the specified range drop down menu. Selecting 'Custom' allows you specify your own time range, while selecting 'Snapshot' allows you to select a specific date and time.
The graph type can also be changed from the drop down menu.
The View Tab
The View tab contains read-only parameters displayed within a table. The table displays read-only parameter values, short code and descriptions. These are grouped and displayed by parameter type.
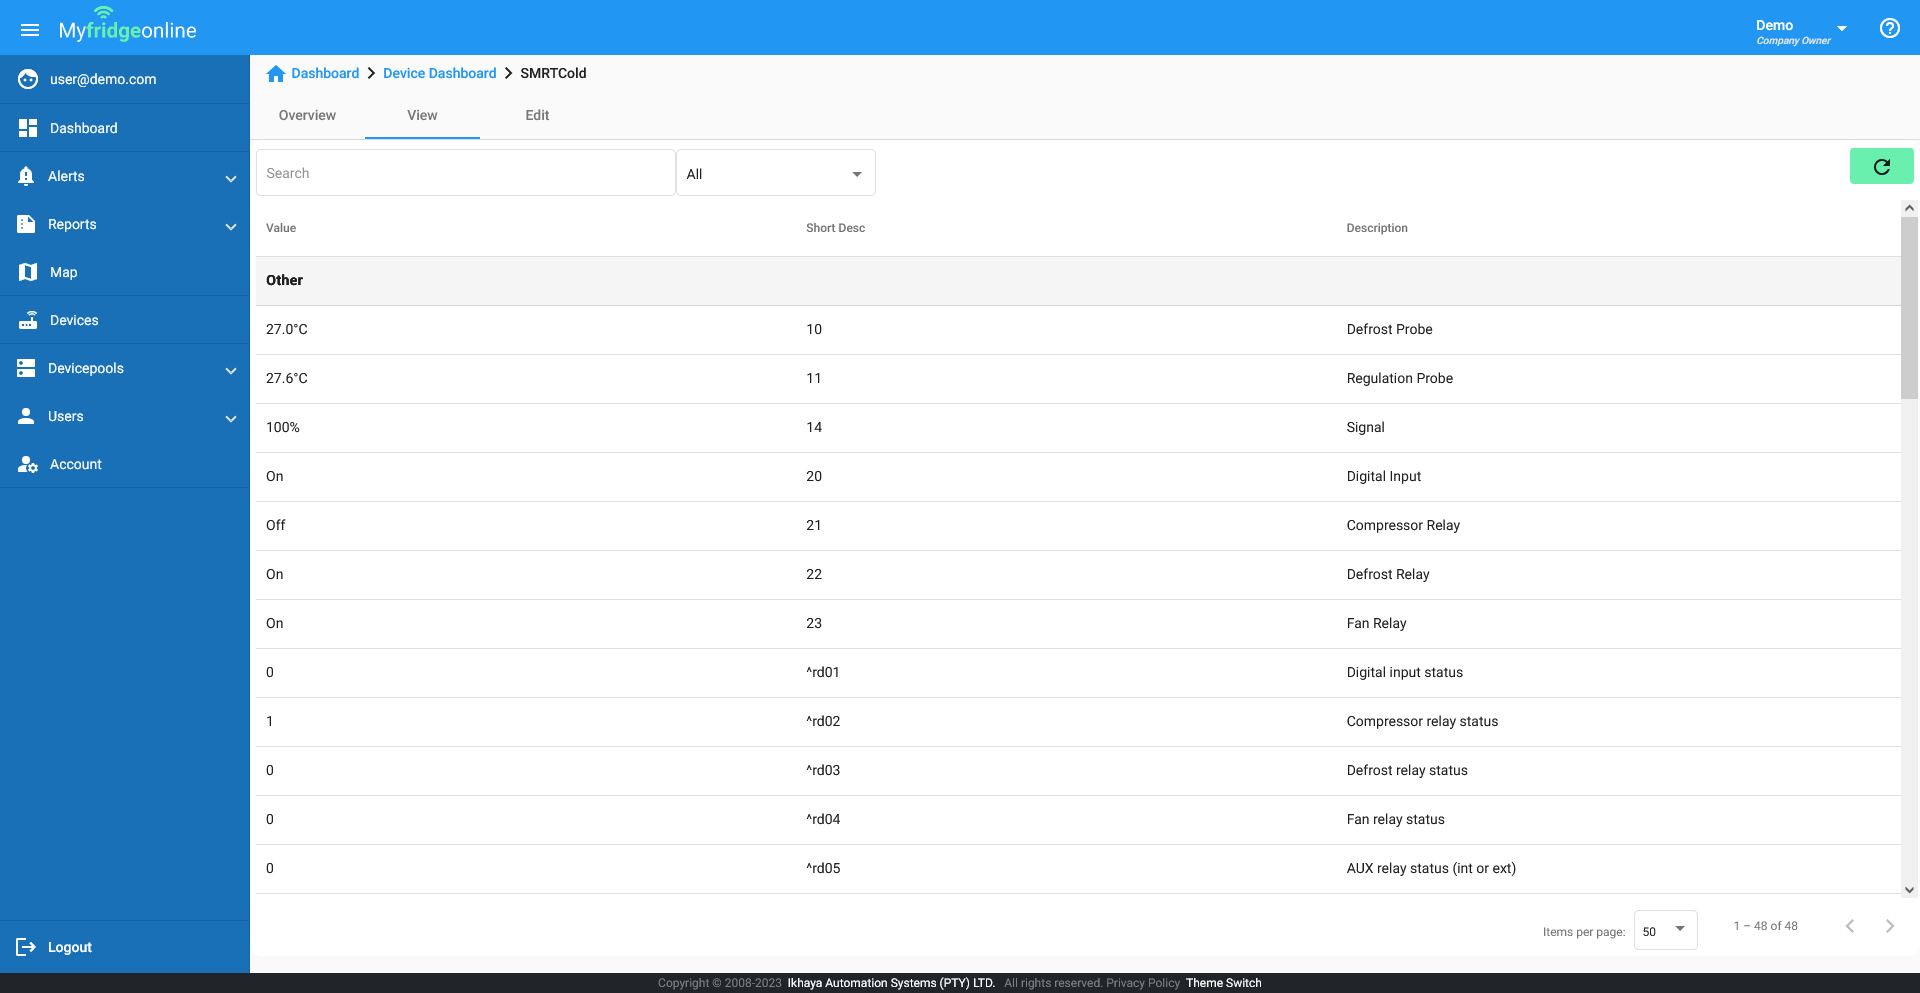
These can be searched through from the search bar and can be filtered by type using the drop-down menu.
The Edit Tab
The Edit Tab contains contains editable parameters displayed within a table. The table displays editable parameter values, short code and descriptions. These are grouped and displayed by parameter type.
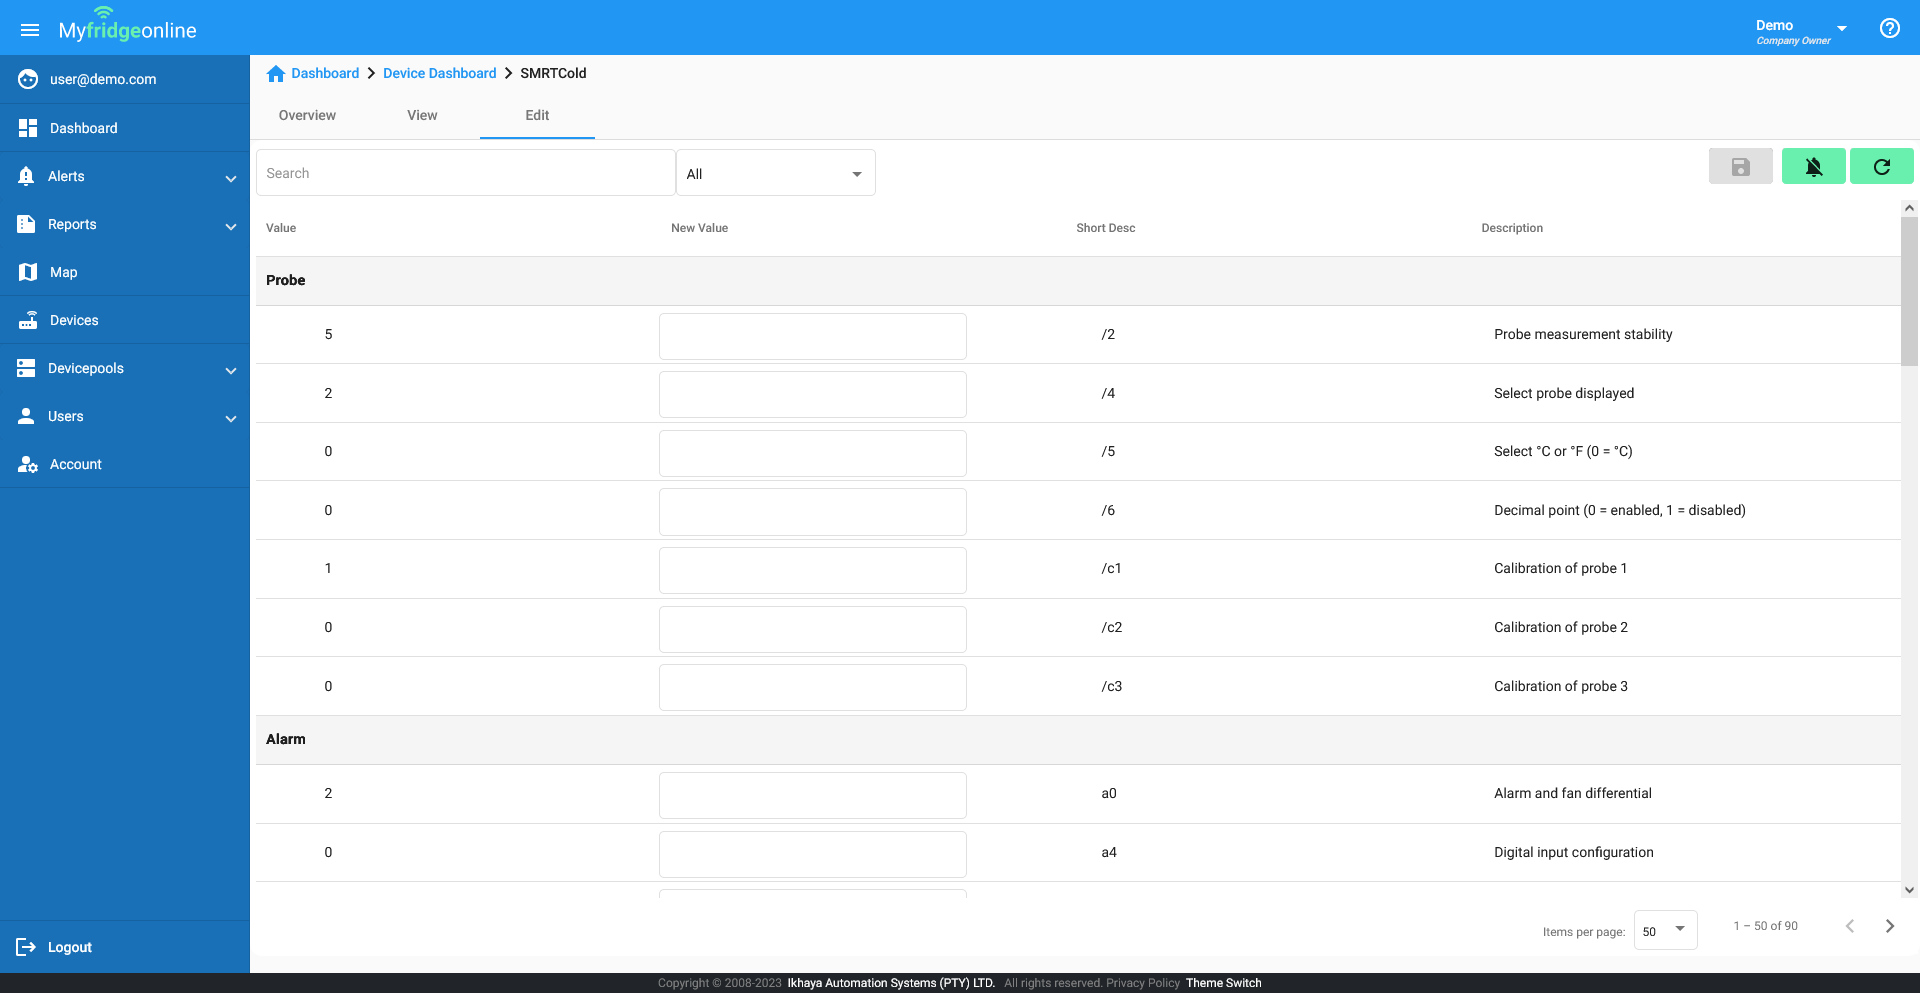
These can be searched through from the search bar and can be filtered by type using the drop-down menu.
Editing Parameter Values
Entering a value into the 'New Value' field will allow you to assign a new value to the parameter. Doing so will also highlight the field in green if it is a valid value. The save button will allow you to save this value once complete. Multiple fields can be edited simultaneously.
Once complete, click the Save button on the right side of the screen, to save your changes.

Setting Up Board Alerts
Alerts determined by the controller can be configured by clicking on the bell icon. This will bring up the edit dialog for the Defrost Probe. Adding the SMRT Cold Board alert rule to the Defrost Probe allows alerts to be dispatched from the server when one or more controller alarms get triggered.
To configure this rule follow the following steps:
- Click the plus button and select the rule named Board Alert.

- Configure the alert by adding a delay. Delays determine the duration at which the value remain above or below the given configuration before an alert is dispatched.

- Select an alert group.

- After you are done click save, then click submit.


Alerts will now be dispatched to the users in the alert group when the controllers’ alarms are triggered.