Graphing Sensors
Navigation
The Sensor Graph dialog can be accessed from the Device/Devicepool View page.
Overview
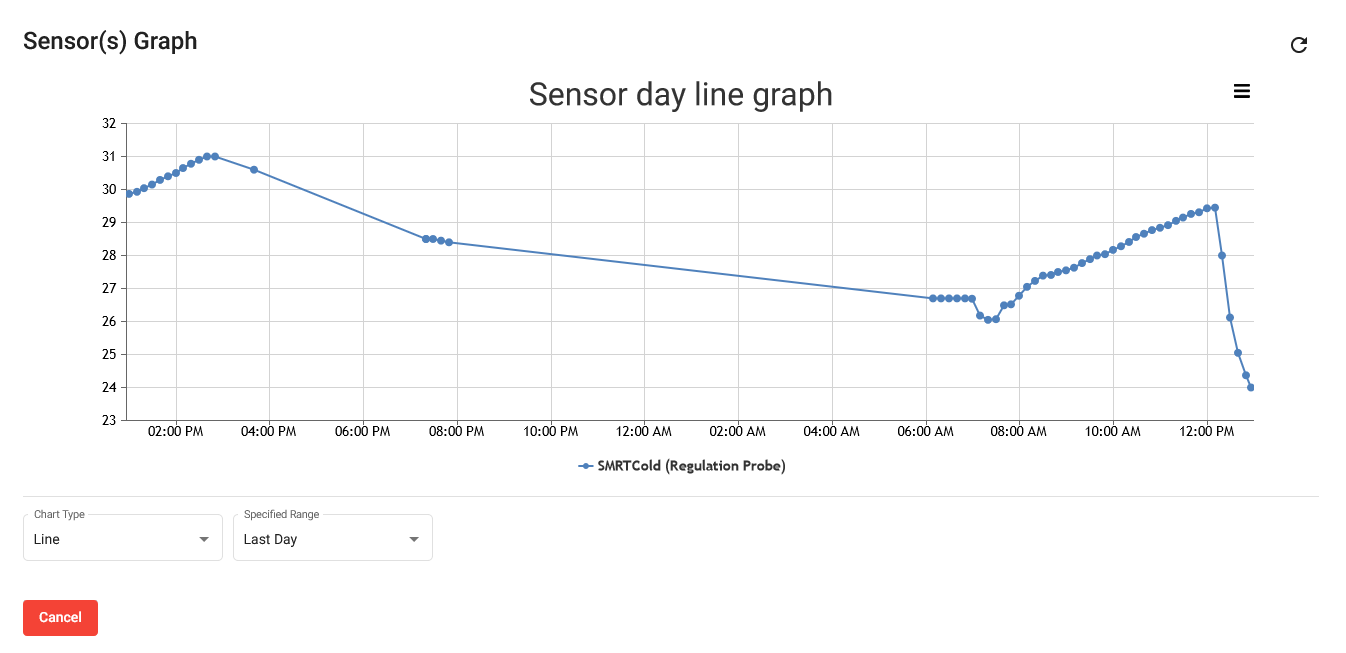
On this page, graphs for the selected sensors are displayed.
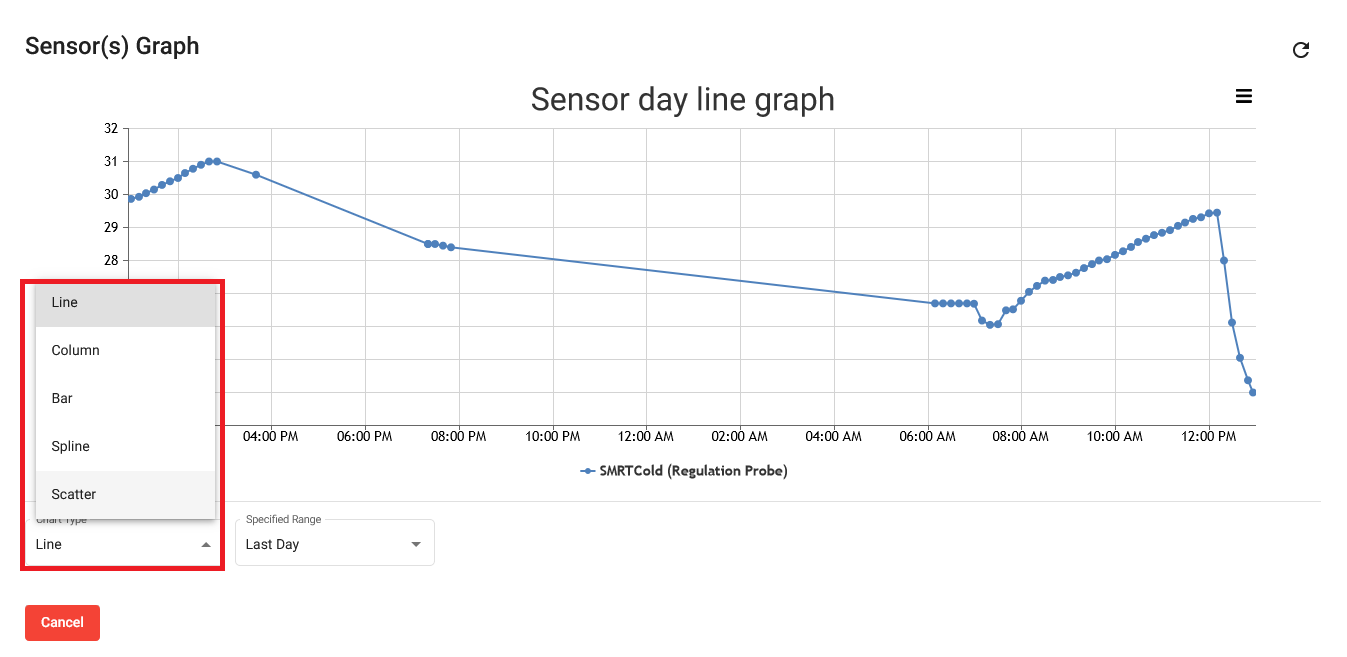
Several graph types are offered. These can be accessed from the drop down menu.
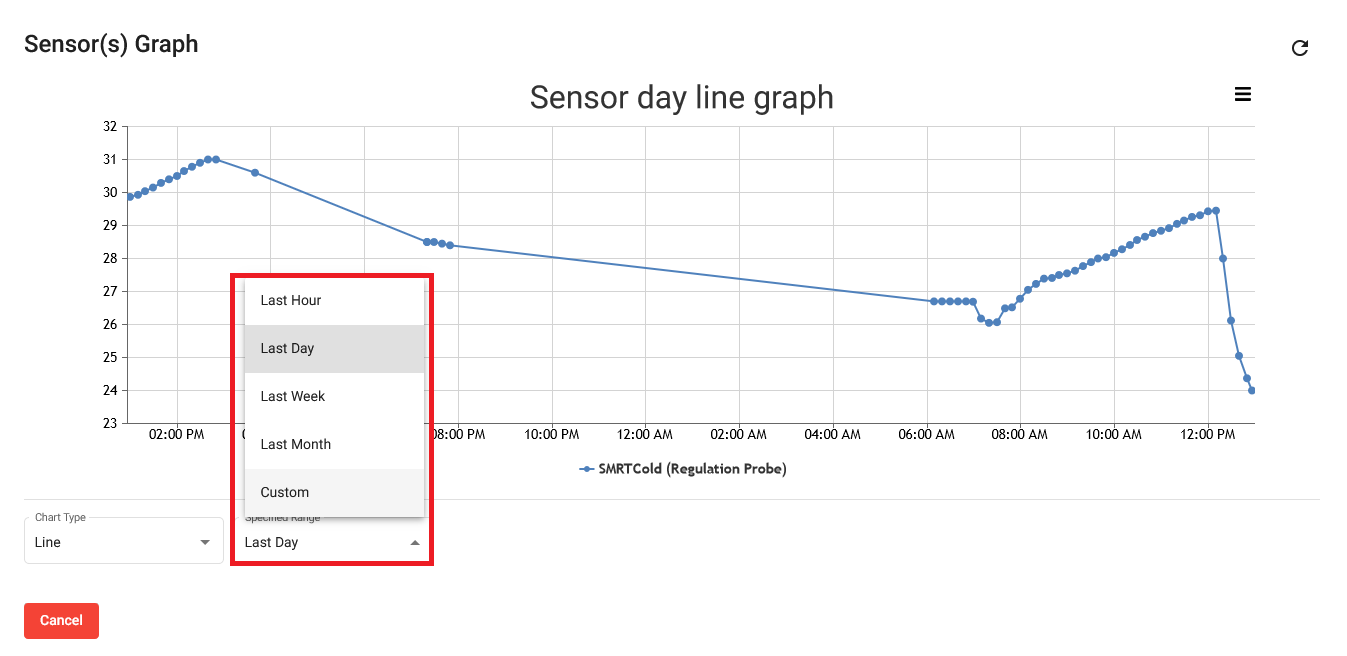
Time ranges can also be selected via the specified range drop down menu. Selecting 'Custom' allows you specify your own time range, while selecting 'Snapshot' allows you to select a specific date and time.